Deploying a game to app stores is only the beginning. The real challenge starts after that. You need to analyze your games performance to take better decisions. Analyzing your game statistics is a very important part of your game/app lifecycle. It is very important to understand how many players are playing your game at a given time and how much load your app is experiencing in order to decide what package you should buy. If you buy a higher package but the traffic is less, you will end up wasting your precious money. So its important to understand what Billing plan you should opt for. You also need to understand your audience behavior to make meaningful decisions. For example starting a campaign at the time of day when users are less will not produce good results.
El lanzamiento de un juego en las tiendas de aplicaciones es solo el comienzo. El verdadero reto empieza después. Necesita analizar el rendimiento de sus juegos para tomar mejores decisiones. Analizar las estadísticas de su juego es una parte muy importante del ciclo de vida de su juego/aplicación. Es muy importante entender cuántos jugadores están jugando su juego en un tiempo dado y la cantidad de carga que su aplicación experimenta con el fin de saber que paquete necesita comprar. Si compra un paquete muy grande pero es tráfico es menos, terminará desperdiciando su preciado dinero. Así que es importante entender cuál es el paquete por el que debe optar. También debe entender el comportamiento de su audiencia para tomar decisiones significativas. Por ejemplo, empezar una campaña a la hora del día en que hay menos usuarios no producirá buenos resultados.
Until now you could view the number of messages and CCUs for previous two weeks in AppWarp. The stats were updated after every few hours. There was no way to check out real time performance of your game. But now you can do this too.
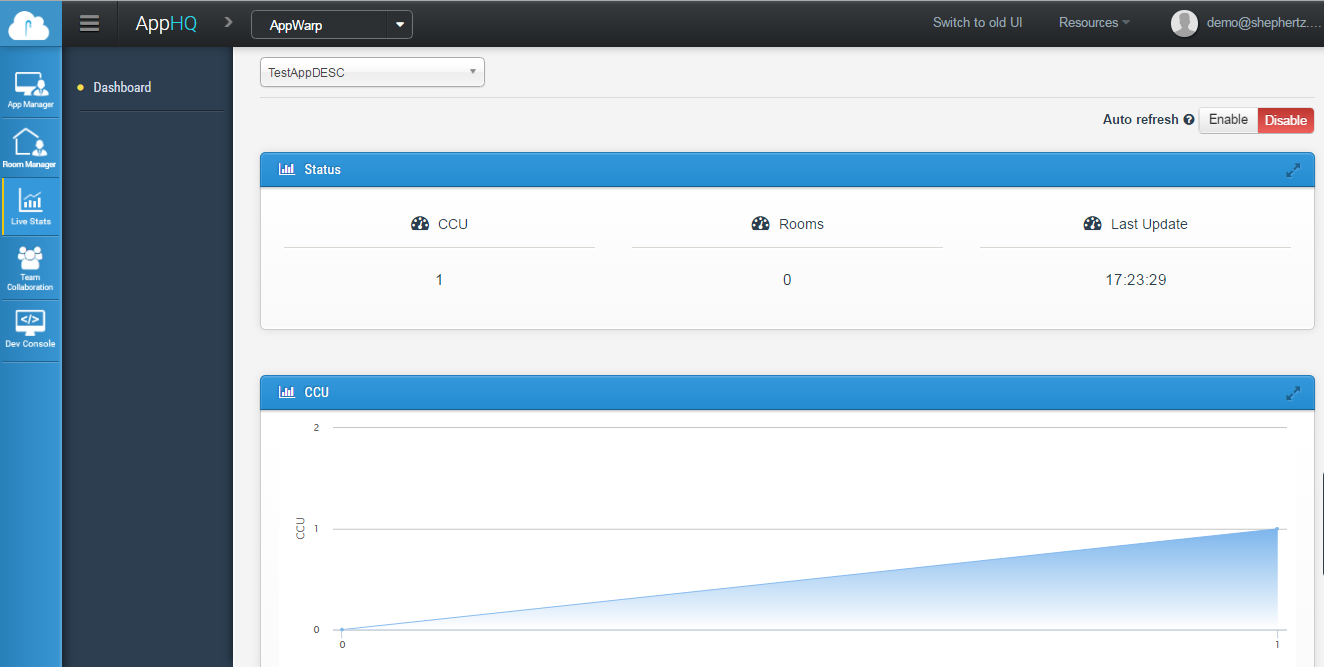
With the addition of a new “Real Time Analytics” feature in AppHQ, now you can view the real time performance of your game. With this new feature you can see a live graph of total number of players in your game. You can even view the graph for number of rooms in your game.
How to view real time analytics?
Follow the following steps in order to view the graph.
- Visit AppHQ Dashboard
- Login with your user id and password
- Select AppWarp Cloud in the AppHQ Menu Sidebar
- Click on Live Stats
- Select your App from the Application List in top left sub area
- Your graph will load once connection status is successful
Sample Graph

Real-time CCU Graph
The left graph will show you real time information for CCUs(Concurrent Connected Users) over time. The y-axis shows the number of users against the x-axis which represents the time.
Real-time Rooms Graph
The right graph will show you real time information for Rooms count over time. Similar to the CCU graph; the y-axis shows the number of rooms against the x-axis which represents the time.
Hasta ahora usted podía ver el número de mensajes y CCUs por las dos semanas anteriores. Las estadísticas se actualizaban después de algunas horas. No había manera de ver el rendimiento de su juego en tiempo real. Pero ahora puede hacerlo.
Con la adición de una nueva función “Análisis en Tiempo Real” en AppHQ, ahora puede ver el rendimiento de su aplicación en tiempo real. Con esta nueva función puede ver un gráfico en vivo del número total de jugadores en su juego. Incluso puede ver el grafico del número de salas en su juego.
¿Cómo ver el análisis en tiempo real?
Siga los siguientes pasos:
-
Visite el AppHQ Dashboard
-
Ingrese con su ID de usuario y contraseña
-
Seleccione AppWarp Cloud en el menú de la barra lateral
-
Click en Real Time Analytics
-
Seleccione su aplicación desde la lista de aplicación en la parte superior izquierda en la sub área
-
Su grafico se cargara una vez el estado de conexión sea exitoso.
Gráfico de muestra

Grafico CCU en tiempo real
El grafico de la izquierda le mostrara la información en tiempo real para CCUs (Usuarios concurrentes conectados) con el tiempo.
Gráfico de salas en tiempo real
El grafico de la derecha le mostrara la información en tiempo real para el conteo de las Salas con el tiempo. Similarmente al grafico CCU, el eje y le muestra el número de salas contra el eje x que representa el tiempo


Leave A Reply